African countries ranked by access to basic drinking water
The 51 African countries with a 2024 estimate, ranked by the share of their people who could use at least a basic drinking water service, the lowest share first.
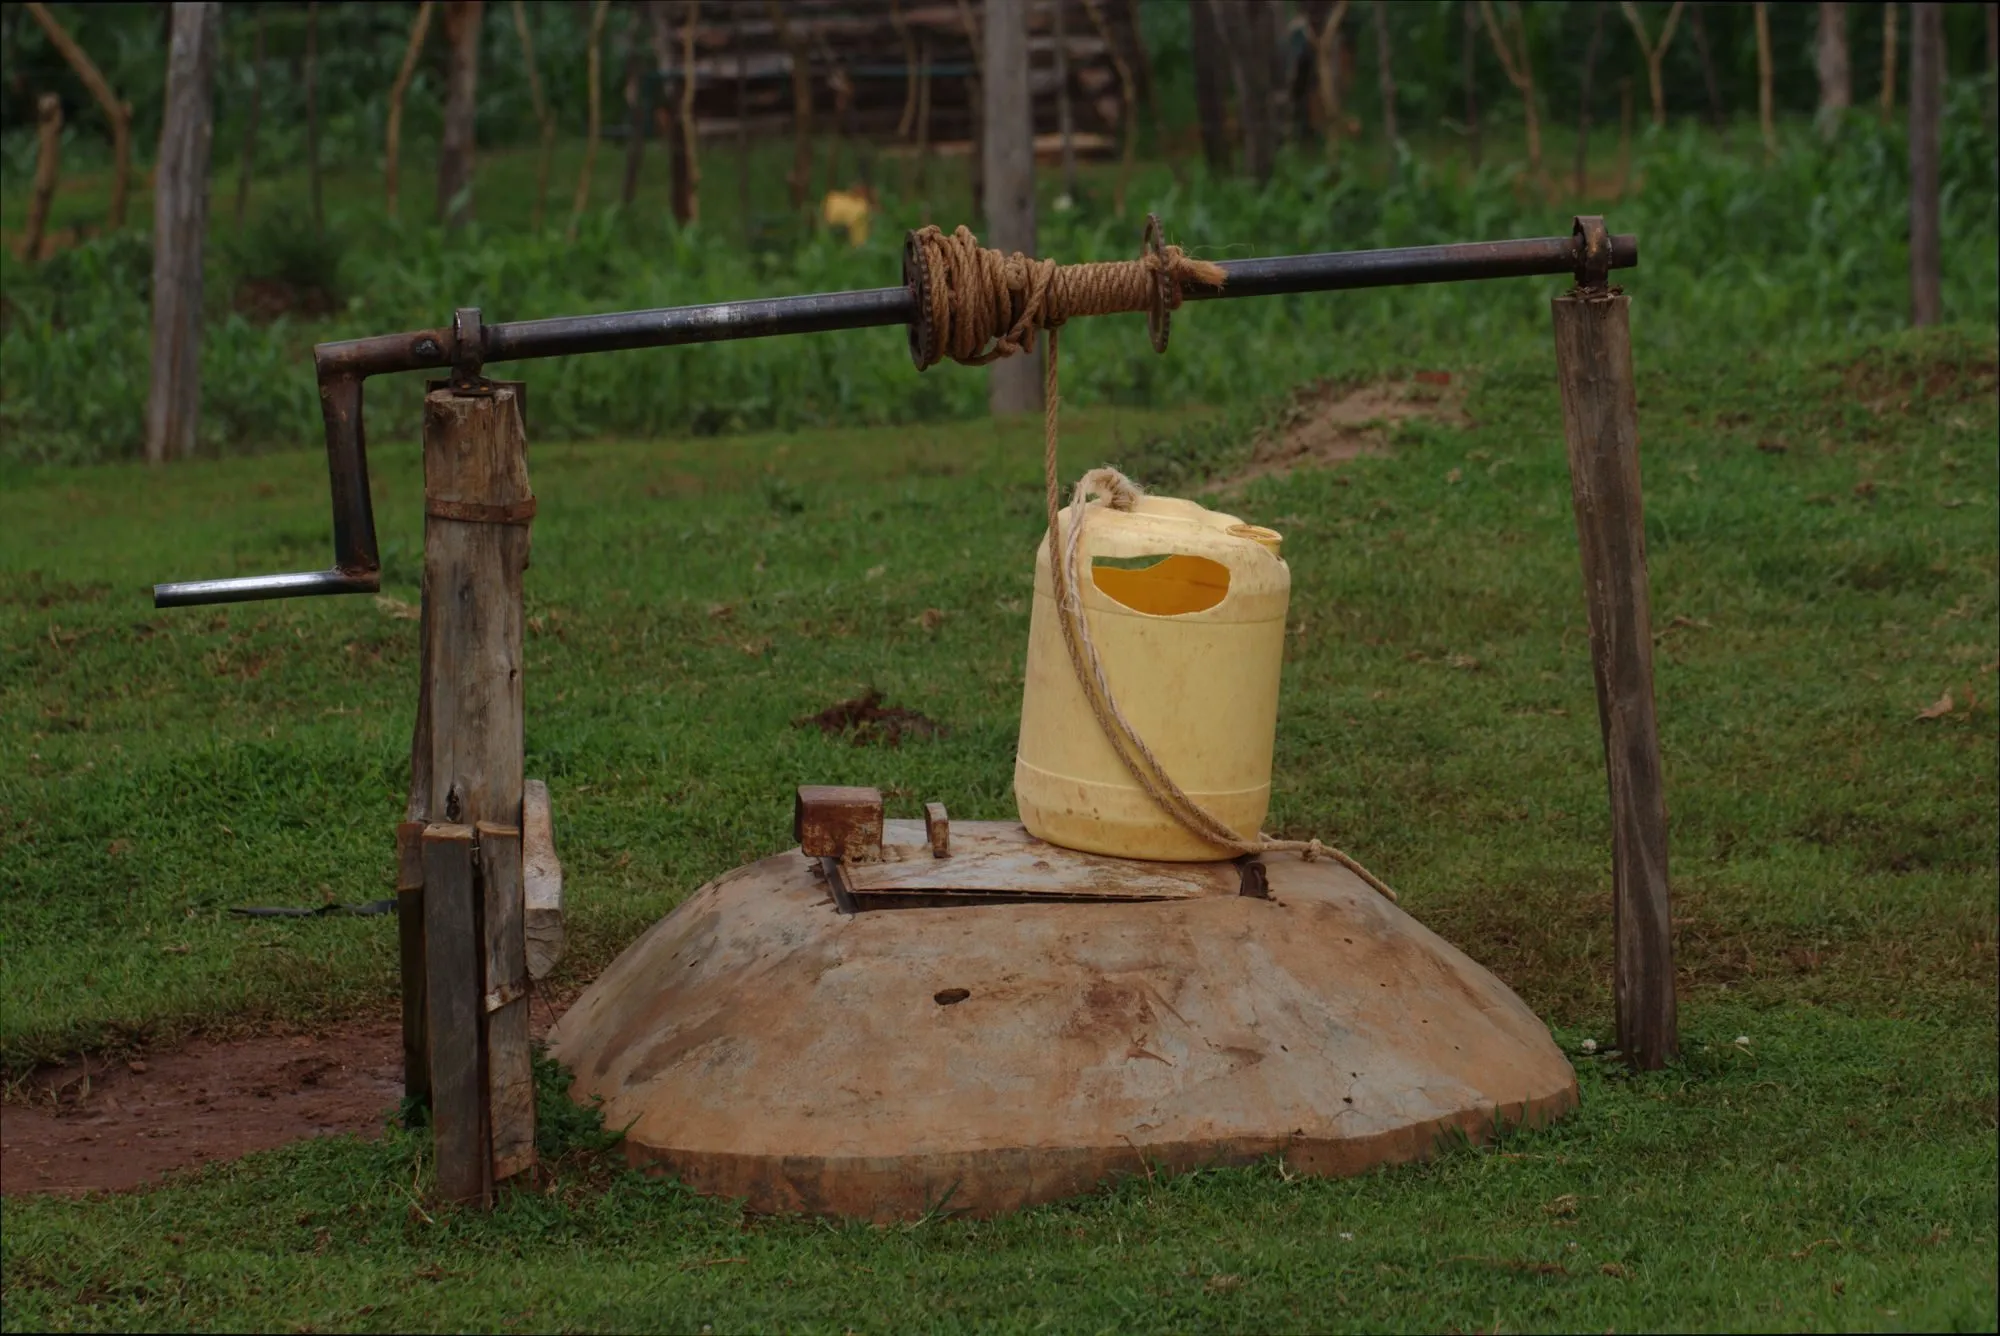
A basic drinking water service means water from an improved source with a round trip to collect it, including queuing, of no more than 30 minutes. A person without it uses an unimproved source or surface water, or faces a longer trip to collect water.
The table ranks the 51 African countries, lowest first. The Democratic Republic of the Congo comes first, with only 35.7% of its people using at least a basic service, then the Central African Republic with 36.5% and South Sudan with 39.7%. Mauritius is at the other end with 99.9%. The chart shows the ten with the lowest access.
Key figures
Share of people using at least basic drinking water, African countries, 2024
Rank 1 has the lowest access. The countries are those the World Bank places in sub-Saharan Africa, plus Algeria, Djibouti, Egypt, Libya, Morocco and Tunisia. Figures are percent of the national population, rounded to one decimal.
| Rank | Country | Percent of people who can use at least basic drinking water (an improved source within a 30-minute round trip) | Year |
|---|---|---|---|
| 1 | Democratic Republic of the Congo | 35.7 | 2024 |
| 2 | Central African Republic | 36.5 | 2024 |
| 3 | South Sudan | 39.7 | 2024 |
| 4 | Burkina Faso | 50.0 | 2024 |
| 5 | Chad | 52.2 | 2024 |
| 6 | Niger | 53.4 | 2024 |
| 7 | Madagascar | 55.3 | 2024 |
| 8 | Ethiopia | 55.6 | 2024 |
| 9 | Rwanda | 61.4 | 2024 |
| 10 | Guinea-Bissau | 61.8 | 2024 |
| 11 | Uganda | 63.0 | 2024 |
| 12 | United Republic of Tanzania | 64.6 | 2024 |
| 13 | Togo | 64.8 | 2024 |
| 14 | Sudan | 64.9 | 2024 |
| 15 | Kenya | 65.6 | 2024 |
| 16 | Burundi | 65.9 | 2024 |
| 17 | Mozambique | 66.6 | 2024 |
| 18 | Zimbabwe | 67.2 | 2024 |
| 19 | Angola | 68.0 | 2024 |
| 20 | Sierra Leone | 68.1 | 2024 |
| 21 | Benin | 69.6 | 2024 |
| 22 | Cameroon | 71.4 | 2024 |
| 23 | Malawi | 73.1 | 2024 |
| 24 | Zambia | 73.4 | 2024 |
| 25 | Guinea | 74.2 | 2024 |
| 26 | Somalia | 75.3 | 2024 |
| 27 | Côte d'Ivoire | 77.2 | 2024 |
| 28 | Mauritania | 77.3 | 2024 |
| 29 | Sao Tome and Principe | 78.0 | 2024 |
| 30 | Lesotho | 78.1 | 2024 |
| 31 | Liberia | 78.8 | 2024 |
| 32 | Djibouti | 79.7 | 2024 |
| 33 | Eswatini | 80.4 | 2024 |
| 34 | Nigeria | 82.2 | 2024 |
| 35 | Comoros | 85.1 | 2024 |
| 36 | Mali | 86.4 | 2024 |
| 37 | Namibia | 86.5 | 2024 |
| 38 | Gambia | 87.1 | 2024 |
| 39 | Senegal | 88.0 | 2024 |
| 40 | Gabon | 88.6 | 2024 |
| 41 | Ghana | 89.9 | 2024 |
| 42 | South Africa | 90.2 | 2024 |
| 43 | Botswana | 91.8 | 2024 |
| 44 | Morocco | 92.2 | 2024 |
| 45 | Cabo Verde | 92.3 | 2024 |
| 46 | Algeria | 92.4 | 2024 |
| 47 | Libya | 96.4 | 2024 |
| 48 | Tunisia | 96.7 | 2024 |
| 49 | Egypt | 97.3 | 2024 |
| 50 | Seychelles | 97.7 | 2024 |
| 51 | Mauritius | 99.9 | 2024 |
Collecting water in Africa
- Over half of the 287 million people worldwide who use only a limited drinking water service, 167 million, live in sub-Saharan Africa.
- In sub-Saharan Africa one round trip to collect water takes around 33 minutes on average in rural areas and 25 minutes in urban areas.
- An estimated 40 billion hours a year are spent collecting water in Sub-Saharan Africa.
The 10 African countries where the fewest people have even basic drinking water, 2024
| Category | % of people who have at least basic drinking water |
|---|---|
| Democratic Republic of the Congo | 35.7 |
| Central African Republic | 36.5 |
| South Sudan | 39.7 |
| Burkina Faso | 50.0 |
| Chad | 52.2 |
| Niger | 53.4 |
| Madagascar | 55.3 |
| Ethiopia | 55.6 |
| Rwanda | 61.4 |
| Guinea-Bissau | 61.8 |
What the numbers mean
A low share here means many people still use sources that are unprotected, far away or taken straight from surface water. In the Democratic Republic of the Congo only 35.7% of people had at least a basic service in 2024, and in the three lowest countries fewer than two in five did.
Basic is the minimum, not the goal: it says nothing about whether the water is safe to drink, which is why the safely managed table is a different ranking. These are national averages, and coverage in rural areas is lower than in cities.
Sources
- Access to Water and Sanitation for All (World Bank speech)
- Countries and regions (World Bank data API)
- Harnessing the Power of Data for Girls: Taking stock and looking ahead to 2030 (UNICEF)
- Progress on household drinking water, sanitation and hygiene 2000-2024: special focus on inequalities (WHO/UNICEF JMP)
- UNICEF data warehouse: WASH in households, JMP estimates for 2024 (WHO/UNICEF Joint Monitoring Programme)