Countries where the most people spend over 30 minutes collecting water
The 203 countries with a 2024 estimate, ranked by the share of their people who use an improved water source but spend more than 30 minutes on a round trip to collect it, the highest share first.
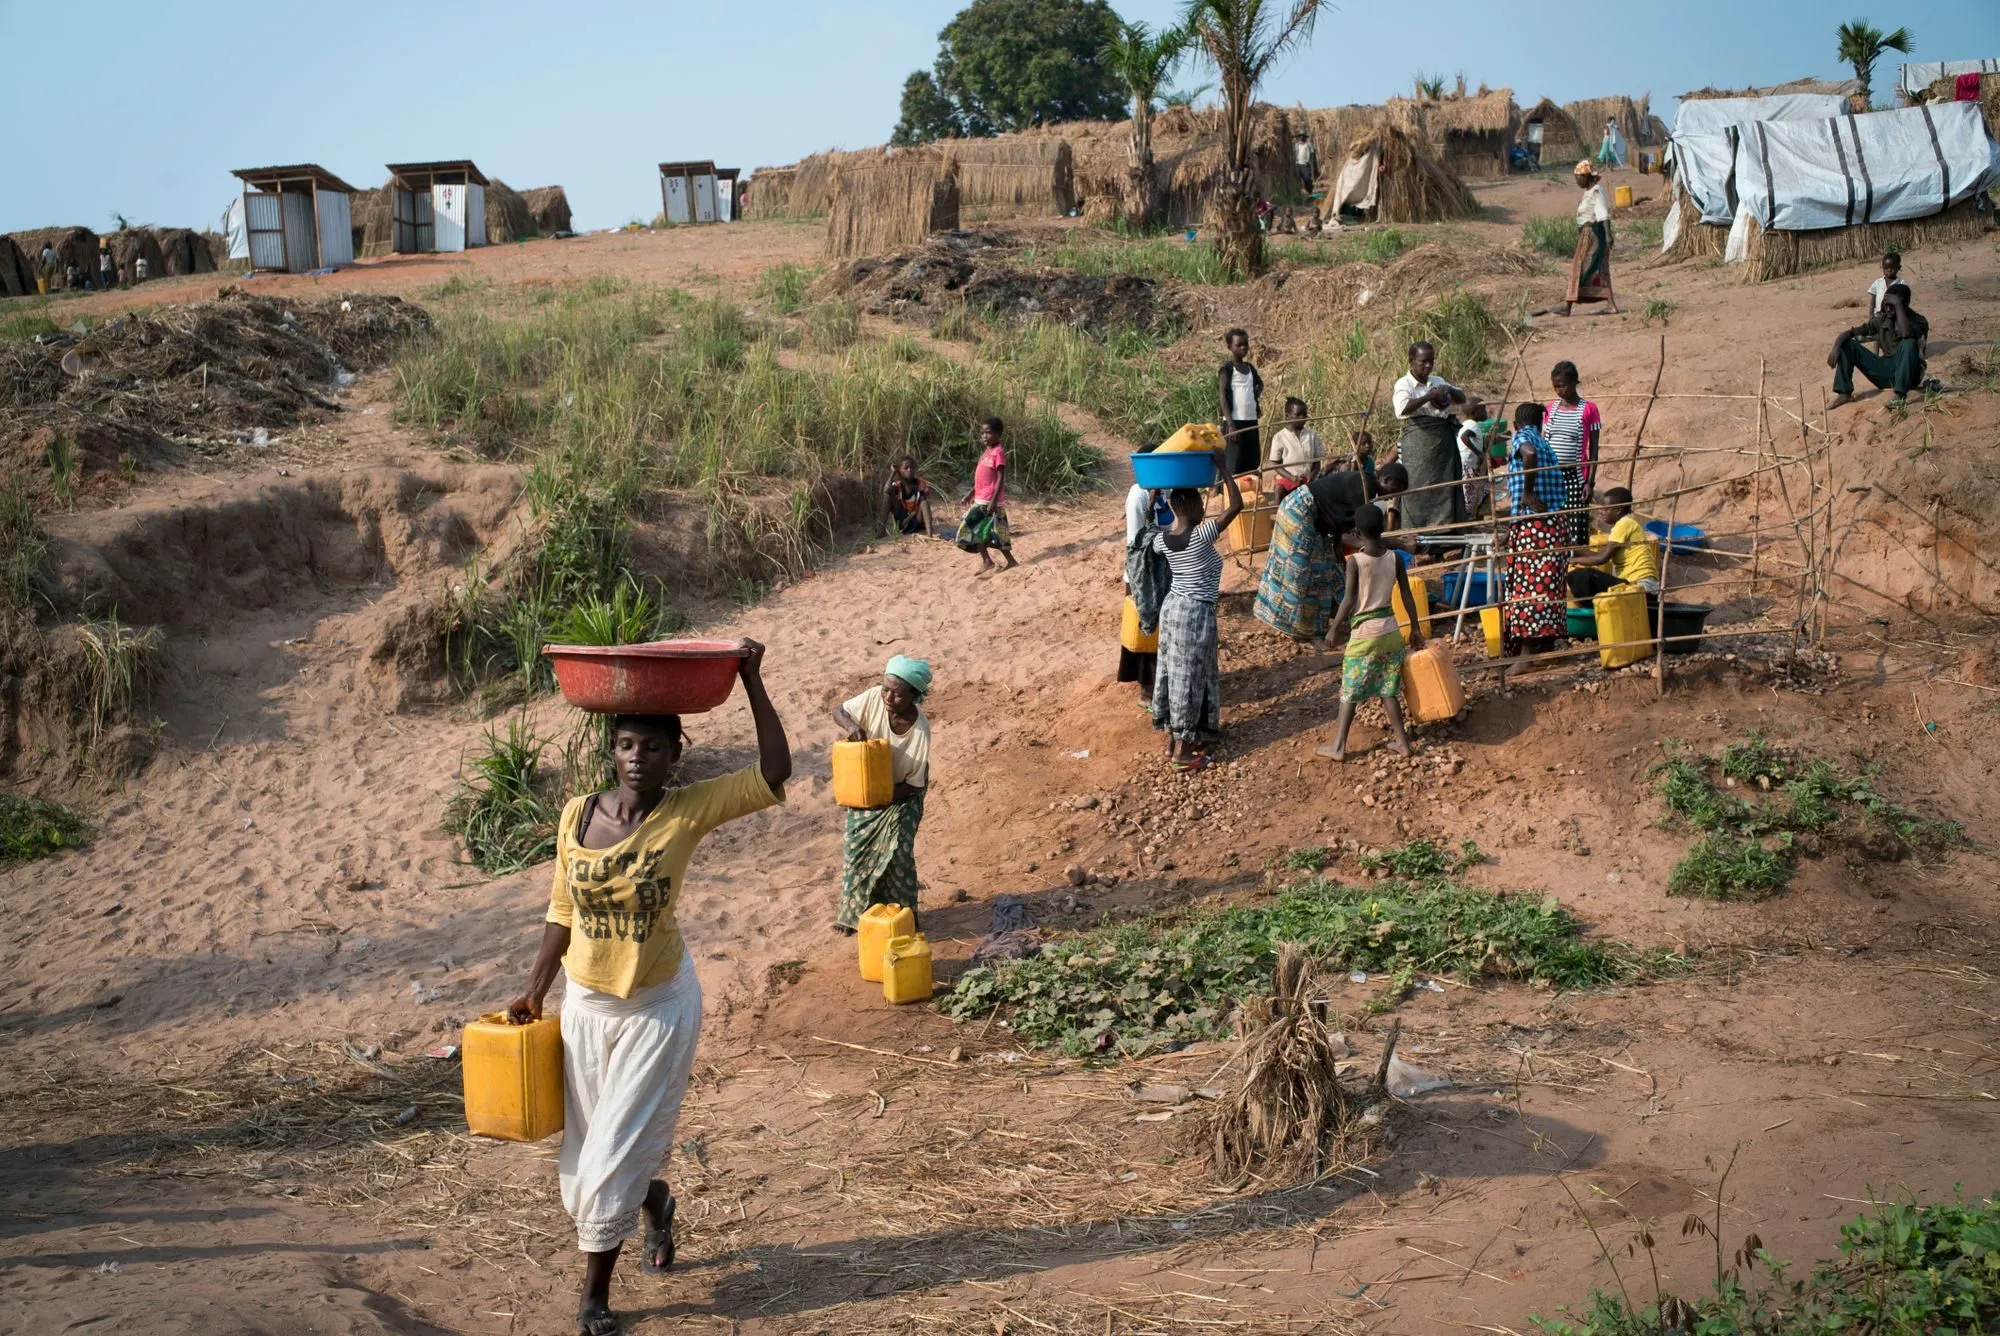
In most homes water arrives by tap. In others someone has to carry it, and the time that takes decides whether getting water is a chore or a day's work. The WHO and UNICEF count a household as having only a limited service when it uses an improved source but the round trip to collect water, including queuing, takes more than 30 minutes.
The table ranks countries by the share of their people in that position in 2024. South Sudan is first with 37.9%, then Burkina Faso with 31.8%, Sudan with 28.8% and Ethiopia with 27.7%. The people who use unimproved sources or surface water are counted in other groups, so the table shows only part of the time burden.
Key figures
Share of people who spend over 30 minutes collecting water, by country, 2024
Rank 1 has the highest share. Countries with the same rounded share have the same rank. The share counts people who use an improved source with a round trip over 30 minutes; it does not say how much longer than 30 minutes the trip takes.
| Rank | Country | Percent of people who use an improved water source but spend over 30 minutes on a round trip to collect it | Year |
|---|---|---|---|
| 1 | South Sudan | 37.9 | 2024 |
| 2 | Burkina Faso | 31.8 | 2024 |
| 3 | Sudan | 28.8 | 2024 |
| 4 | Ethiopia | 27.7 | 2024 |
| 5 | Central African Republic | 26.8 | 2024 |
| 6 | Democratic Republic of the Congo | 24.1 | 2024 |
| 7 | Uganda | 23.1 | 2024 |
| 8 | Rwanda | 22.8 | 2024 |
| 9 | Malawi | 21.1 | 2024 |
| 10 | Sao Tome and Principe | 20.5 | 2024 |
| 11 | Burundi | 20.4 | 2024 |
| 12 | Togo | 17.5 | 2024 |
| 13 | Niger | 16.7 | 2024 |
| 14 | Yemen | 15.8 | 2024 |
| 15 | Djibouti | 15.6 | 2024 |
| 16= | Guinea-Bissau | 14.9 | 2024 |
| 16= | Cameroon | 14.9 | 2024 |
| 18 | Zimbabwe | 14.3 | 2024 |
| 19 | United Republic of Tanzania | 12.8 | 2024 |
| 20 | Chad | 12.5 | 2024 |
| 21 | Mauritania | 12.3 | 2024 |
| 22 | Guinea | 12.0 | 2024 |
| 23 | Marshall Islands | 11.4 | 2024 |
| 24 | Angola | 11.2 | 2024 |
| 25 | Haiti | 11.1 | 2024 |
| 26 | Comoros | 11.0 | 2024 |
| 27 | Jamaica | 10.5 | 2024 |
| 28= | Cambodia | 9.3 | 2024 |
| 28= | Lesotho | 9.3 | 2024 |
| 30 | Kenya | 8.8 | 2024 |
| 31 | Liberia | 8.7 | 2024 |
| 32 | Mozambique | 8.6 | 2024 |
| 33 | Somalia | 7.6 | 2024 |
| 34= | South Africa | 7.5 | 2024 |
| 34= | Sierra Leone | 7.5 | 2024 |
| 34= | El Salvador | 7.5 | 2024 |
| 37= | Lebanon | 7.4 | 2024 |
| 37= | Benin | 7.4 | 2024 |
| 39 | Papua New Guinea | 7.3 | 2024 |
| 40 | Oman | 7.1 | 2024 |
| 41= | Namibia | 7.0 | 2024 |
| 41= | Côte d'Ivoire | 7.0 | 2024 |
| 41= | Zambia | 7.0 | 2024 |
| 44 | Kosovo (UNSCR 1244) | 6.9 | 2024 |
| 45 | Indonesia | 6.3 | 2024 |
| 46 | Solomon Islands | 6.2 | 2024 |
| 47 | Eswatini | 6.1 | 2024 |
| 48 | Gambia | 5.9 | 2024 |
| 49= | Gabon | 5.8 | 2024 |
| 49= | Cabo Verde | 5.8 | 2024 |
| 49= | Syrian Arab Republic | 5.8 | 2024 |
| 52 | Ukraine | 5.7 | 2024 |
| 53 | Mongolia | 5.5 | 2024 |
| 54 | Madagascar | 5.0 | 2024 |
| 55= | Mali | 4.7 | 2024 |
| 55= | Algeria | 4.7 | 2024 |
| 57= | Pakistan | 4.5 | 2024 |
| 57= | Kiribati | 4.5 | 2024 |
| 57= | Timor-Leste | 4.5 | 2024 |
| 57= | Ghana | 4.5 | 2024 |
| 61 | Botswana | 4.3 | 2024 |
| 62 | Afghanistan | 4.0 | 2024 |
| 63= | Bosnia and Herzegovina | 3.9 | 2024 |
| 63= | Ecuador | 3.9 | 2024 |
| 63= | Morocco | 3.9 | 2024 |
| 63= | Serbia | 3.9 | 2024 |
| 63= | Nigeria | 3.9 | 2024 |
| 68 | Libya | 3.5 | 2024 |
| 69 | Nepal | 3.4 | 2024 |
| 70 | Vanuatu | 3.1 | 2024 |
| 71 | Türkiye | 3.0 | 2024 |
| 72 | Tajikistan | 2.9 | 2024 |
| 73= | Philippines | 2.8 | 2024 |
| 73= | Senegal | 2.8 | 2024 |
| 75 | Cuba | 2.7 | 2024 |
| 76 | Guyana | 2.5 | 2024 |
| 77= | Kyrgyzstan | 2.3 | 2024 |
| 77= | India | 2.3 | 2024 |
| 79 | Kazakhstan | 2.0 | 2024 |
| 80= | Albania | 1.9 | 2024 |
| 80= | Panama | 1.9 | 2024 |
| 80= | Tunisia | 1.9 | 2024 |
| 80= | Iran (Islamic Republic of) | 1.9 | 2024 |
| 84 | Saint Lucia | 1.8 | 2024 |
| 85= | Guatemala | 1.6 | 2024 |
| 85= | Republic of Moldova | 1.6 | 2024 |
| 85= | North Macedonia | 1.6 | 2024 |
| 88 | Uzbekistan | 1.4 | 2024 |
| 89= | Sri Lanka | 1.2 | 2024 |
| 89= | State of Palestine | 1.2 | 2024 |
| 89= | Belize | 1.2 | 2024 |
| 89= | Czechia | 1.2 | 2024 |
| 93= | Azerbaijan | 1.1 | 2024 |
| 93= | Suriname | 1.1 | 2024 |
| 95= | Turks and Caicos Islands | 1.0 | 2024 |
| 95= | Georgia | 1.0 | 2024 |
| 95= | Tonga | 1.0 | 2024 |
| 95= | Honduras | 1.0 | 2024 |
| 99 | Iraq | 0.9 | 2024 |
| 100 | Egypt | 0.8 | 2024 |
| 101= | Fiji | 0.7 | 2024 |
| 101= | Myanmar | 0.7 | 2024 |
| 101= | Latvia | 0.7 | 2024 |
| 101= | Saudi Arabia | 0.7 | 2024 |
| 101= | Bangladesh | 0.7 | 2024 |
| 106= | Montenegro | 0.6 | 2024 |
| 106= | Russian Federation | 0.6 | 2024 |
| 106= | Nauru | 0.6 | 2024 |
| 109= | Peru | 0.5 | 2024 |
| 109= | Venezuela (Bolivarian Republic of) | 0.5 | 2024 |
| 109= | Dominican Republic | 0.5 | 2024 |
| 112= | Bhutan | 0.4 | 2024 |
| 112= | Malaysia | 0.4 | 2024 |
| 112= | Uruguay | 0.4 | 2024 |
| 112= | Tuvalu | 0.4 | 2024 |
| 112= | Paraguay | 0.4 | 2024 |
| 117= | Trinidad and Tobago | 0.3 | 2024 |
| 117= | Barbados | 0.3 | 2024 |
| 119= | Colombia | 0.2 | 2024 |
| 119= | Costa Rica | 0.2 | 2024 |
| 119= | China | 0.2 | 2024 |
| 119= | Slovakia | 0.2 | 2024 |
| 123= | Jordan | 0.1 | 2024 |
| 123= | Bolivia (Plurinational State of) | 0.1 | 2024 |
| 125= | Guam | 0.0 | 2024 |
| 125= | United Arab Emirates | 0.0 | 2024 |
| 125= | Isle of Man | 0.0 | 2024 |
| 125= | Greenland | 0.0 | 2024 |
| 125= | Liechtenstein | 0.0 | 2024 |
| 125= | Belarus | 0.0 | 2024 |
| 125= | Armenia | 0.0 | 2024 |
| 125= | New Zealand | 0.0 | 2024 |
| 125= | Kuwait | 0.0 | 2024 |
| 125= | Italy | 0.0 | 2024 |
| 125= | Seychelles | 0.0 | 2024 |
| 125= | Malta | 0.0 | 2024 |
| 125= | France | 0.0 | 2024 |
| 125= | Australia | 0.0 | 2024 |
| 125= | Japan | 0.0 | 2024 |
| 125= | San Marino | 0.0 | 2024 |
| 125= | Brazil | 0.0 | 2024 |
| 125= | Hungary | 0.0 | 2024 |
| 125= | Portugal | 0.0 | 2024 |
| 125= | New Caledonia | 0.0 | 2024 |
| 125= | Lao People's Democratic Republic | 0.0 | 2024 |
| 125= | Estonia | 0.0 | 2024 |
| 125= | Antigua and Barbuda | 0.0 | 2024 |
| 125= | Faroe Islands | 0.0 | 2024 |
| 125= | Belgium | 0.0 | 2024 |
| 125= | Cayman Islands | 0.0 | 2024 |
| 125= | Switzerland | 0.0 | 2024 |
| 125= | Finland | 0.0 | 2024 |
| 125= | Austria | 0.0 | 2024 |
| 125= | Saint Martin (French part) | 0.0 | 2024 |
| 125= | Mauritius | 0.0 | 2024 |
| 125= | Slovenia | 0.0 | 2024 |
| 125= | Cyprus | 0.0 | 2024 |
| 125= | Gibraltar | 0.0 | 2024 |
| 125= | Palau | 0.0 | 2024 |
| 125= | Turkmenistan | 0.0 | 2024 |
| 125= | Dominica | 0.0 | 2024 |
| 125= | Virgin Islands U.S. | 0.0 | 2024 |
| 125= | Chile | 0.0 | 2024 |
| 125= | Bulgaria | 0.0 | 2024 |
| 125= | Canada | 0.0 | 2024 |
| 125= | Denmark | 0.0 | 2024 |
| 125= | Sweden | 0.0 | 2024 |
| 125= | Luxembourg | 0.0 | 2024 |
| 125= | American Samoa | 0.0 | 2024 |
| 125= | Netherlands (Kingdom of the) | 0.0 | 2024 |
| 125= | Lithuania | 0.0 | 2024 |
| 125= | Greece | 0.0 | 2024 |
| 125= | Qatar | 0.0 | 2024 |
| 125= | Ireland | 0.0 | 2024 |
| 125= | Croatia | 0.0 | 2024 |
| 125= | Samoa | 0.0 | 2024 |
| 125= | Bermuda | 0.0 | 2024 |
| 125= | China, Hong Kong Special Administrative Region | 0.0 | 2024 |
| 125= | Iceland | 0.0 | 2024 |
| 125= | Andorra | 0.0 | 2024 |
| 125= | Republic of Korea | 0.0 | 2024 |
| 125= | Norway | 0.0 | 2024 |
| 125= | Romania | 0.0 | 2024 |
| 125= | Monaco | 0.0 | 2024 |
| 125= | Poland | 0.0 | 2024 |
| 125= | Maldives | 0.0 | 2024 |
| 125= | United Kingdom | 0.0 | 2024 |
| 125= | Northern Mariana Islands | 0.0 | 2024 |
| 125= | United States | 0.0 | 2024 |
| 125= | Curaçao | 0.0 | 2024 |
| 125= | Brunei Darussalam | 0.0 | 2024 |
| 125= | Viet Nam | 0.0 | 2024 |
| 125= | China, Macao Special Administrative Region | 0.0 | 2024 |
| 125= | Singapore | 0.0 | 2024 |
| 125= | Germany | 0.0 | 2024 |
| 125= | Puerto Rico | 0.0 | 2024 |
| 125= | Bahrain | 0.0 | 2024 |
| 125= | Israel | 0.0 | 2024 |
| 125= | British Virgin Islands | 0.0 | 2024 |
| 125= | Mexico | 0.0 | 2024 |
| 125= | Spain | 0.0 | 2024 |
| 125= | Thailand | 0.0 | 2024 |
| 125= | French Polynesia | 0.0 | 2024 |
Time spent collecting water
- If a round trip to collect water, including queuing, exceeds 30 minutes, it counts as a limited service, and if it takes no more than 30 minutes, it counts as a basic service.
- In sub-Saharan Africa one round trip to collect water takes around 33 minutes on average in rural areas and 25 minutes in urban areas.
- In 53 countries with data, women and girls spend 250 million hours a day collecting water, over three times more than men and boys.
- 1.8 billion people collect drinking water from supplies located off their premises, and in seven out of ten of those households women and girls are mainly responsible for collecting it.
The 10 countries where the biggest share of people spend over 30 minutes fetching water, 2024
| Category | % of people who spend over 30 minutes fetching water |
|---|---|
| South Sudan | 37.9 |
| Burkina Faso | 31.8 |
| Sudan | 28.8 |
| Ethiopia | 27.7 |
| Central African Republic | 26.8 |
| Democratic Republic of the Congo | 24.1 |
| Uganda | 23.1 |
| Rwanda | 22.8 |
| Malawi | 21.1 |
| Sao Tome and Principe | 20.5 |
What the numbers mean
The table measures a threshold, not the average trip. A household that walks two hours and one that walks 31 minutes count the same, so a high share means many people pass the 30-minute line, not that all of them walk for hours. The countries at the top are all in sub-Saharan Africa.
The burden falls mostly on women and girls: in seven out of ten households that collect water away from home they are mainly responsible, and across 53 countries with data they spend 250 million hours a day on it. People who use unimproved sources or surface water also have to fetch water but are not in this share, so the real time burden is larger than the table shows.
Sources
- Countries and regions (World Bank data API)
- Harnessing the Power of Data for Girls: Taking stock and looking ahead to 2030 (UNICEF)
- Progress on household drinking water, sanitation and hygiene 2000-2022: special focus on gender (WHO/UNICEF JMP)
- Progress on household drinking water, sanitation and hygiene 2000-2024: special focus on inequalities (WHO/UNICEF JMP)
- UNICEF data warehouse: WASH in households, JMP estimates for 2024 (WHO/UNICEF Joint Monitoring Programme)
- World Water Day | United Nations