European countries that lose the most water to leaks
24 European countries ranked by the share of their drinking water lost through leaks in the pipes before it reaches anyone's tap, the most first. The figures are from EurEau's Europe's Water in Figures, 2026 edition, which mostly reflects data for 2022 to 2024.
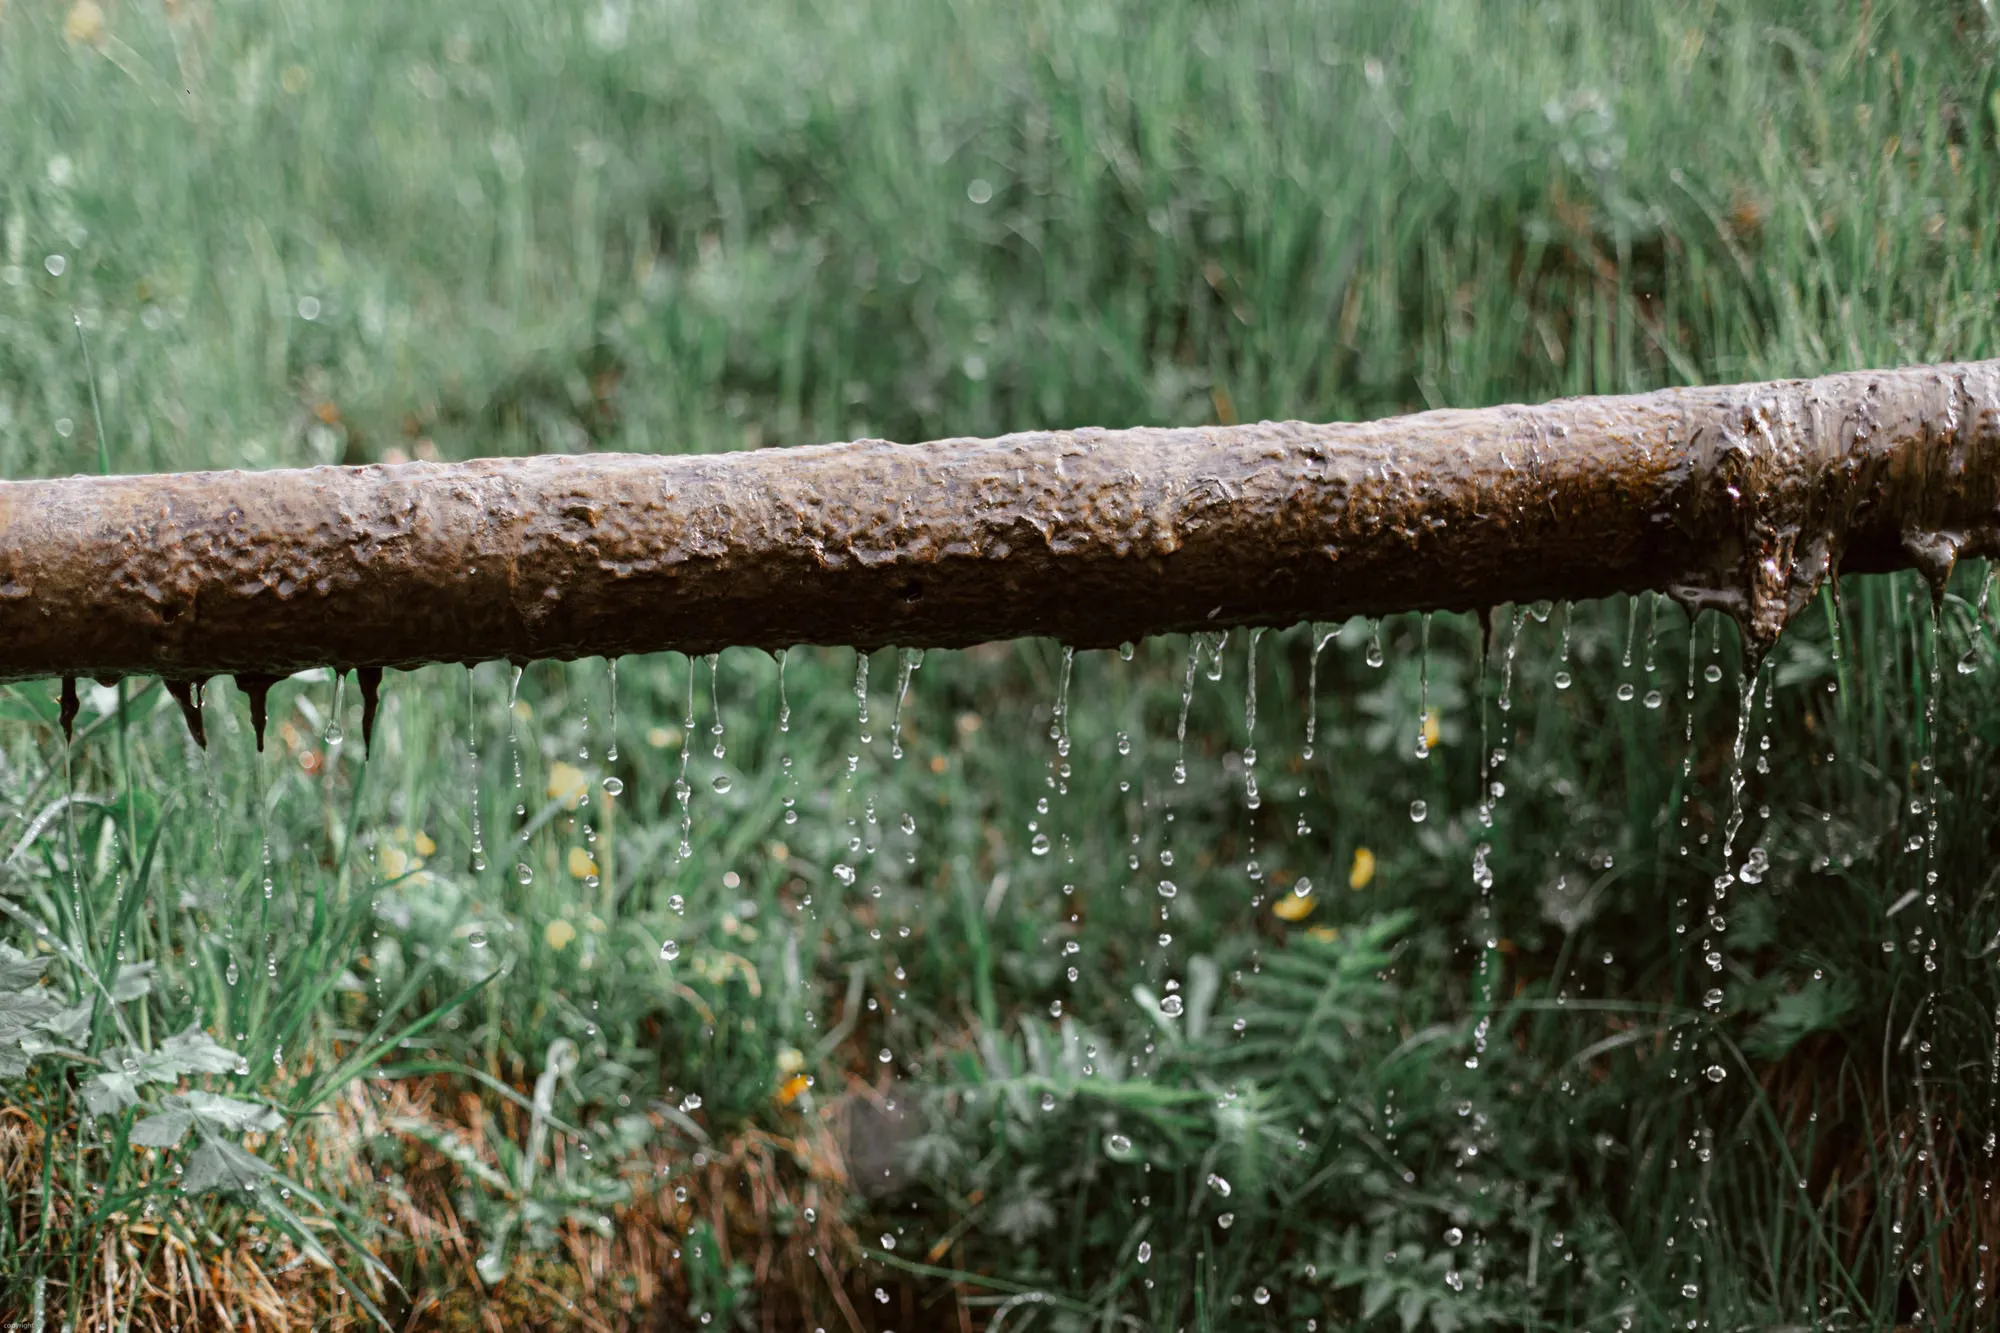
Every water network leaks. Old mains crack, joints loosen and pipes burst, and the water that escapes has already been collected, treated and pumped. EurEau, the federation of Europe's national water associations, collects these figures from its members in each country for its Europe's Water in Figures report.
This page uses real losses: the water that physically leaks out of the distribution network, as a percentage of the water put into it. It is narrower than non-revenue water, which also counts water that is used but not billed, such as for fire-fighting and cleaning mains. The table ranks the countries that reported real losses; the chart shows the ten with the highest.
Key figures
Drinking water lost to leaks, by country, Europe's Water in Figures 2026
Rank 1 loses the largest share. Real losses as a percentage of the water put into the distribution network, as each country's water association reported it; there is no single reference year, most data is for 2022 to 2024. Luxembourg is left out: the report prints 0.0% real losses for it beside 10.0% non-revenue water, which is not a measured leakage figure. No figure for Croatia, Finland, Greece, Latvia, Portugal, Slovakia.
| Rank | Country | Drinking water lost to leaks (%) | Edition |
|---|---|---|---|
| 1 | Romania | 44.7 | 2026 |
| 2 | Italy | 42.0 | 2026 |
| 3 | Bulgaria | 38.0 | 2026 |
| 4 | Ireland | 36.0 | 2026 |
| 5 | Slovenia | 32.0 | 2026 |
| 6 | Norway | 29.0 | 2026 |
| 7 | Belgium | 27.0 | 2026 |
| 8 | Cyprus | 23.0 | 2026 |
| 9= | Hungary | 21.0 | 2026 |
| 9= | Lithuania | 21.0 | 2026 |
| 11= | France | 19.0 | 2026 |
| 11= | Sweden | 19.0 | 2026 |
| 13 | United Kingdom | 17.1 | 2026 |
| 14 | Czechia | 14.8 | 2026 |
| 15= | Estonia | 14.0 | 2026 |
| 15= | Spain | 14.0 | 2026 |
| 17= | Iceland | 13.0 | 2026 |
| 17= | Poland | 13.0 | 2026 |
| 19 | Austria | 12.5 | 2026 |
| 20 | Switzerland | 11.7 | 2026 |
| 21 | Malta | 8.7 | 2026 |
| 22 | Denmark | 6.5 | 2026 |
| 23 | Germany | 6.0 | 2026 |
| 24 | Netherlands | 5.5 | 2026 |
Across Europe
- Across the EU's 27 countries, an average of 22.9% of drinking water is lost to leaks (median 19%).
- Across all the European countries in the report, the average is 21.96% (median 18.03%).
- Counting all water that is put into supply but not billed (non-revenue water), the EU average rises to 28.59%.
- EurEau reports that both real losses and non-revenue water have gone down significantly at the European level since its previous report in 2021.
| Category | % of drinking water lost to leaks |
|---|---|
| Romania | 44.7 |
| Italy | 42.0 |
| Bulgaria | 38.0 |
| Ireland | 36.0 |
| Slovenia | 32.0 |
| Norway | 29.0 |
| Belgium | 27.0 |
| Cyprus | 23.0 |
| Hungary | 21.0 |
| Lithuania | 21.0 |
What the numbers mean
Romania and Italy lose more than two litres in every five they put into their pipes, and Bulgaria and Ireland more than a third. At the other end, the Netherlands, Germany and Denmark lose less than one litre in ten. The average across the EU's 27 countries is 22.9%.
EurEau warns that simply comparing countries can mislead, because water services depend on local conditions such as population density, water sources and topography, and real losses are harder to measure than non-revenue water. A high share is still a plain sign of how much treated water never reaches a tap, and renewing old pipes came out as the top challenge in many countries in EurEau's report.