Water companies in England ranked by leakage
The 17 water companies in England ranked by how much water leaks out of their pipes every day for each property they serve, the worst first, for 2024 to 2025.
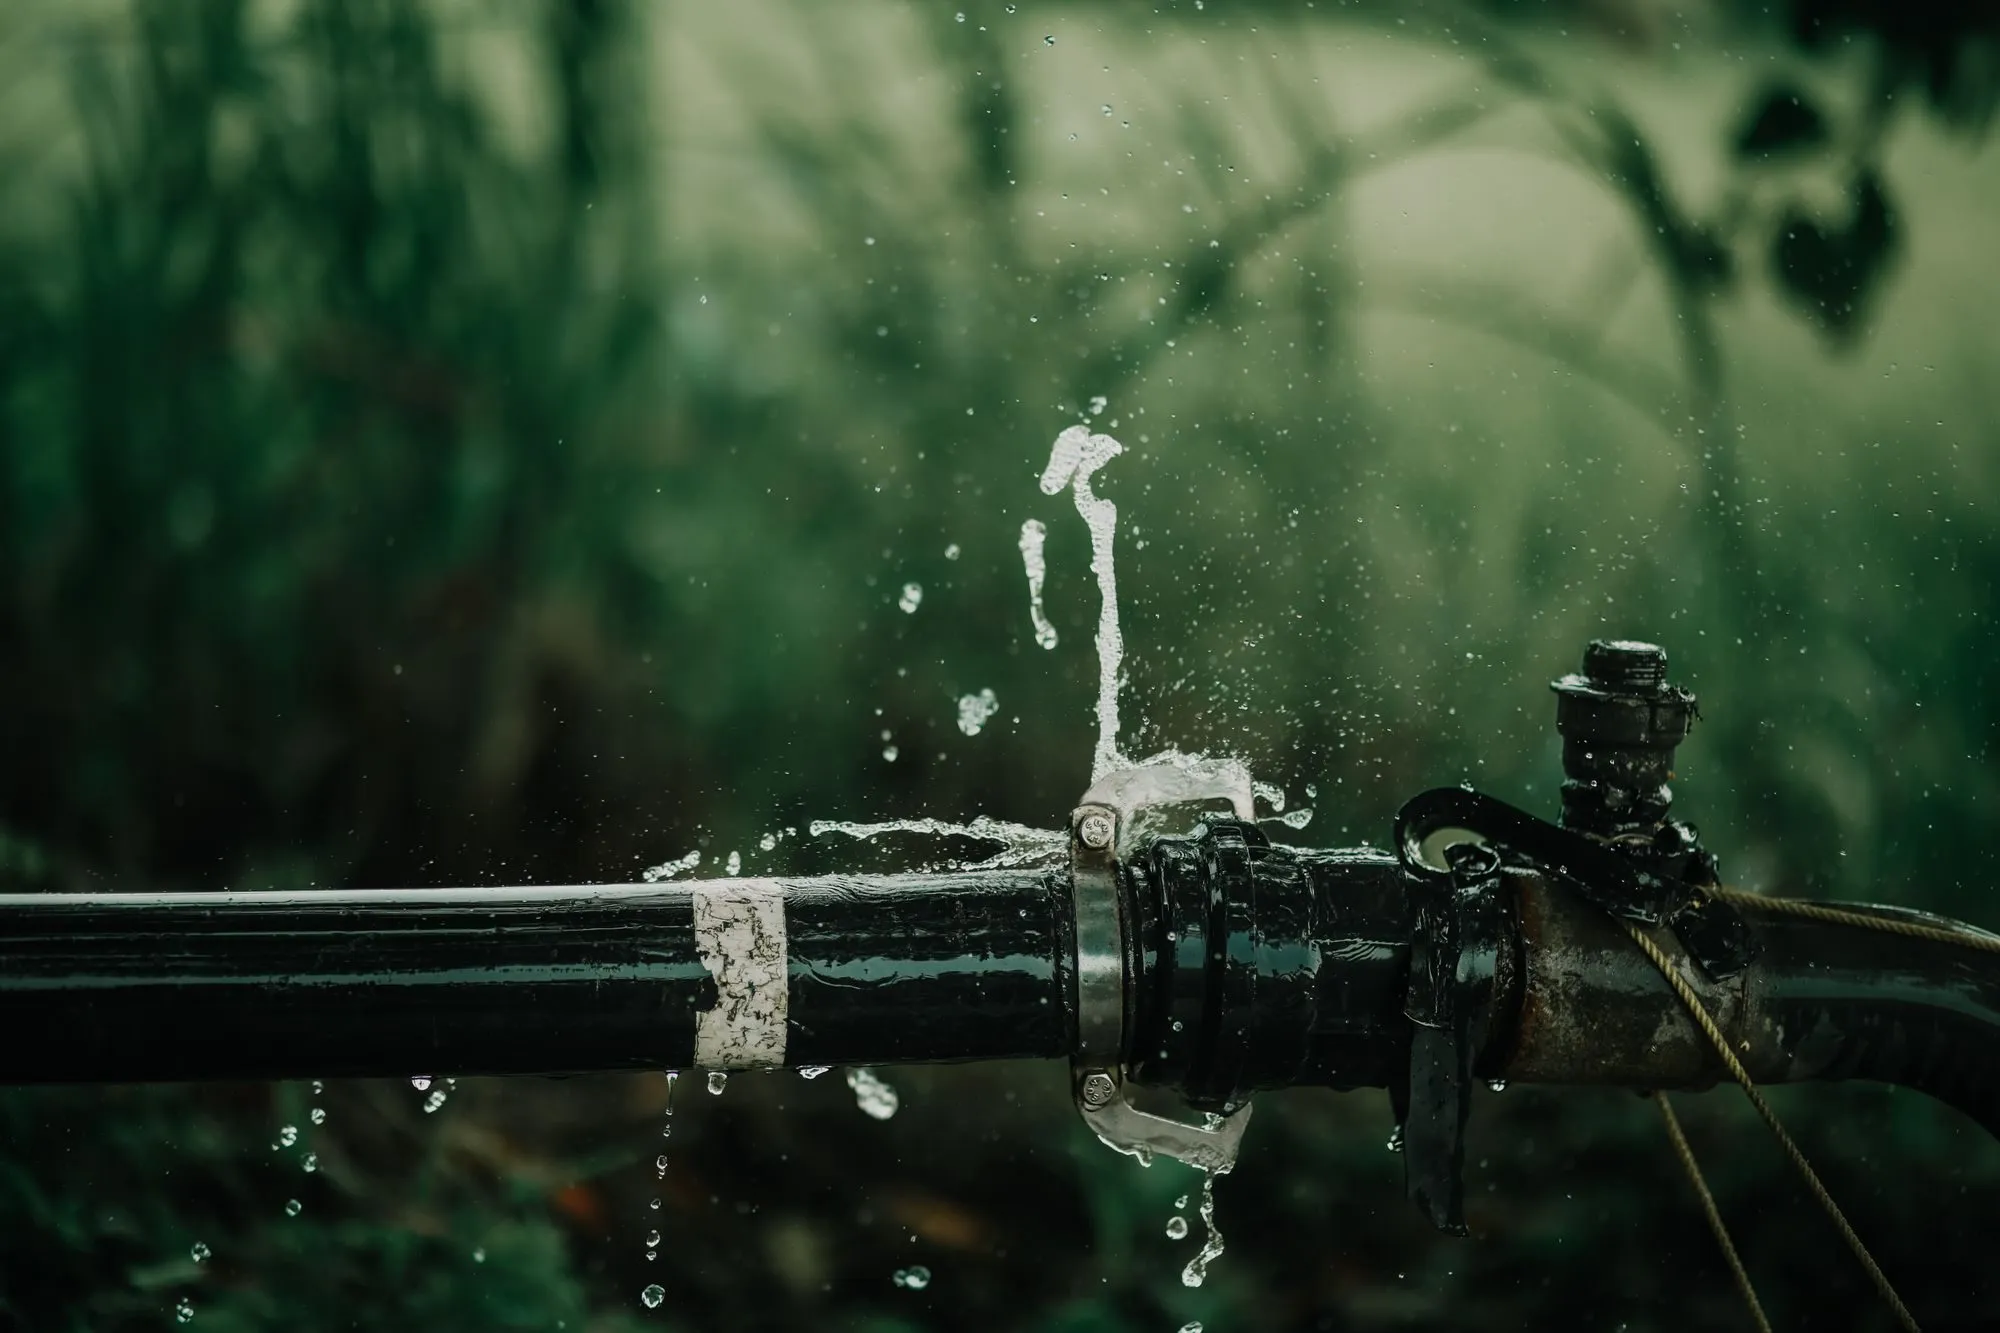
Every water company loses some of the water it puts into its pipes before it reaches a tap. The water escapes through leaking pipes, joints and bursts, and it is counted in litres lost for each property the company serves, each day, so that a small company can be compared fairly with a large one.
The table ranks the 17 companies from the most leakage to the least for 2024 to 2025. Thames Water loses 135.99 litres per property per day, the most in England, against a national average of 101.68, and SES Water loses the least, 64.18. The chart shows the ten worst.
Key figures
Water lost to leaks per property per day, by company, 2024 to 2025
Rank 1 loses the most water. A property is a home or business connected to the supply. The national average is 101.68 litres per property per day. The figures for 2025 to 2026 are expected in late 2026.
| Rank | Water company | Litres of water lost to leaks, per property per day | Year |
|---|---|---|---|
| 1 | Thames Water | 135.99 | 2024 to 2025 |
| 2 | United Utilities | 118.35 | 2024 to 2025 |
| 3 | Yorkshire Water | 108.13 | 2024 to 2025 |
| 4 | Wessex Water | 107.28 | 2024 to 2025 |
| 5 | South East Water | 105.83 | 2024 to 2025 |
| 6 | South West Water | 97.64 | 2024 to 2025 |
| 7 | South Staffs Water | 95.87 | 2024 to 2025 |
| 8 | Affinity Water | 93.11 | 2024 to 2025 |
| 9 | Northumbrian Water | 92.97 | 2024 to 2025 |
| 10 | Severn Trent Water | 88.25 | 2024 to 2025 |
| 11 | Portsmouth Water | 86.01 | 2024 to 2025 |
| 12 | Southern Water | 83.63 | 2024 to 2025 |
| 13 | Anglian Water | 80.93 | 2024 to 2025 |
| 14 | Cambridge Water | 71.42 | 2024 to 2025 |
| 15 | Bristol Water | 65.29 | 2024 to 2025 |
| 16 | Essex & Suffolk Water | 65.27 | 2024 to 2025 |
| 17 | SES Water | 64.18 | 2024 to 2025 |
Leakage measured in other ways
- The national average is 101.68 litres of water lost to leaks per property per day.
- Thames Water loses 53.6 litres of water to leaks per person per day, the most of any company, against a national average of 43.0.
- Thames Water loses 22.5% of the water it puts into supply, the most of any company, against a national average of 18.8%.
- Across England 19% of the water put into supply is lost before it reaches customers.
- The industry has committed to halving leakage by 2050 compared with 2017 to 2018 levels, and has reduced it by 10% so far.
| Category | Litres of water lost per property per day |
|---|---|
| Thames Water | 135.99 |
| United Utilities | 118.35 |
| Yorkshire Water | 108.13 |
| Wessex Water | 107.28 |
| South East Water | 105.83 |
| South West Water | 97.64 |
| South Staffs Water | 95.87 |
| Affinity Water | 93.11 |
| Northumbrian Water | 92.97 |
| Severn Trent Water | 88.25 |
What the numbers mean
Leakage per property is the fairest way to compare companies, because it divides the water lost by the number of properties served. Some difference between companies is expected from geography, the length of the pipe network and the quality of the raw water, so the ranking shows where the loss is highest, not why.
Every company on the table loses water, and the national average is 101.68 litres per property per day. About 19% of the water put into supply across England is lost before it reaches customers, and the industry has promised to halve leakage by 2050 from its 2017 to 2018 level; it has reduced it by 10% so far.