Water companies in England ranked by sewage spills
The 10 water and sewerage companies that run storm overflows in England, ranked by how often each overflow released sewage in 2025, the most first, with each company's total spills and spill hours.
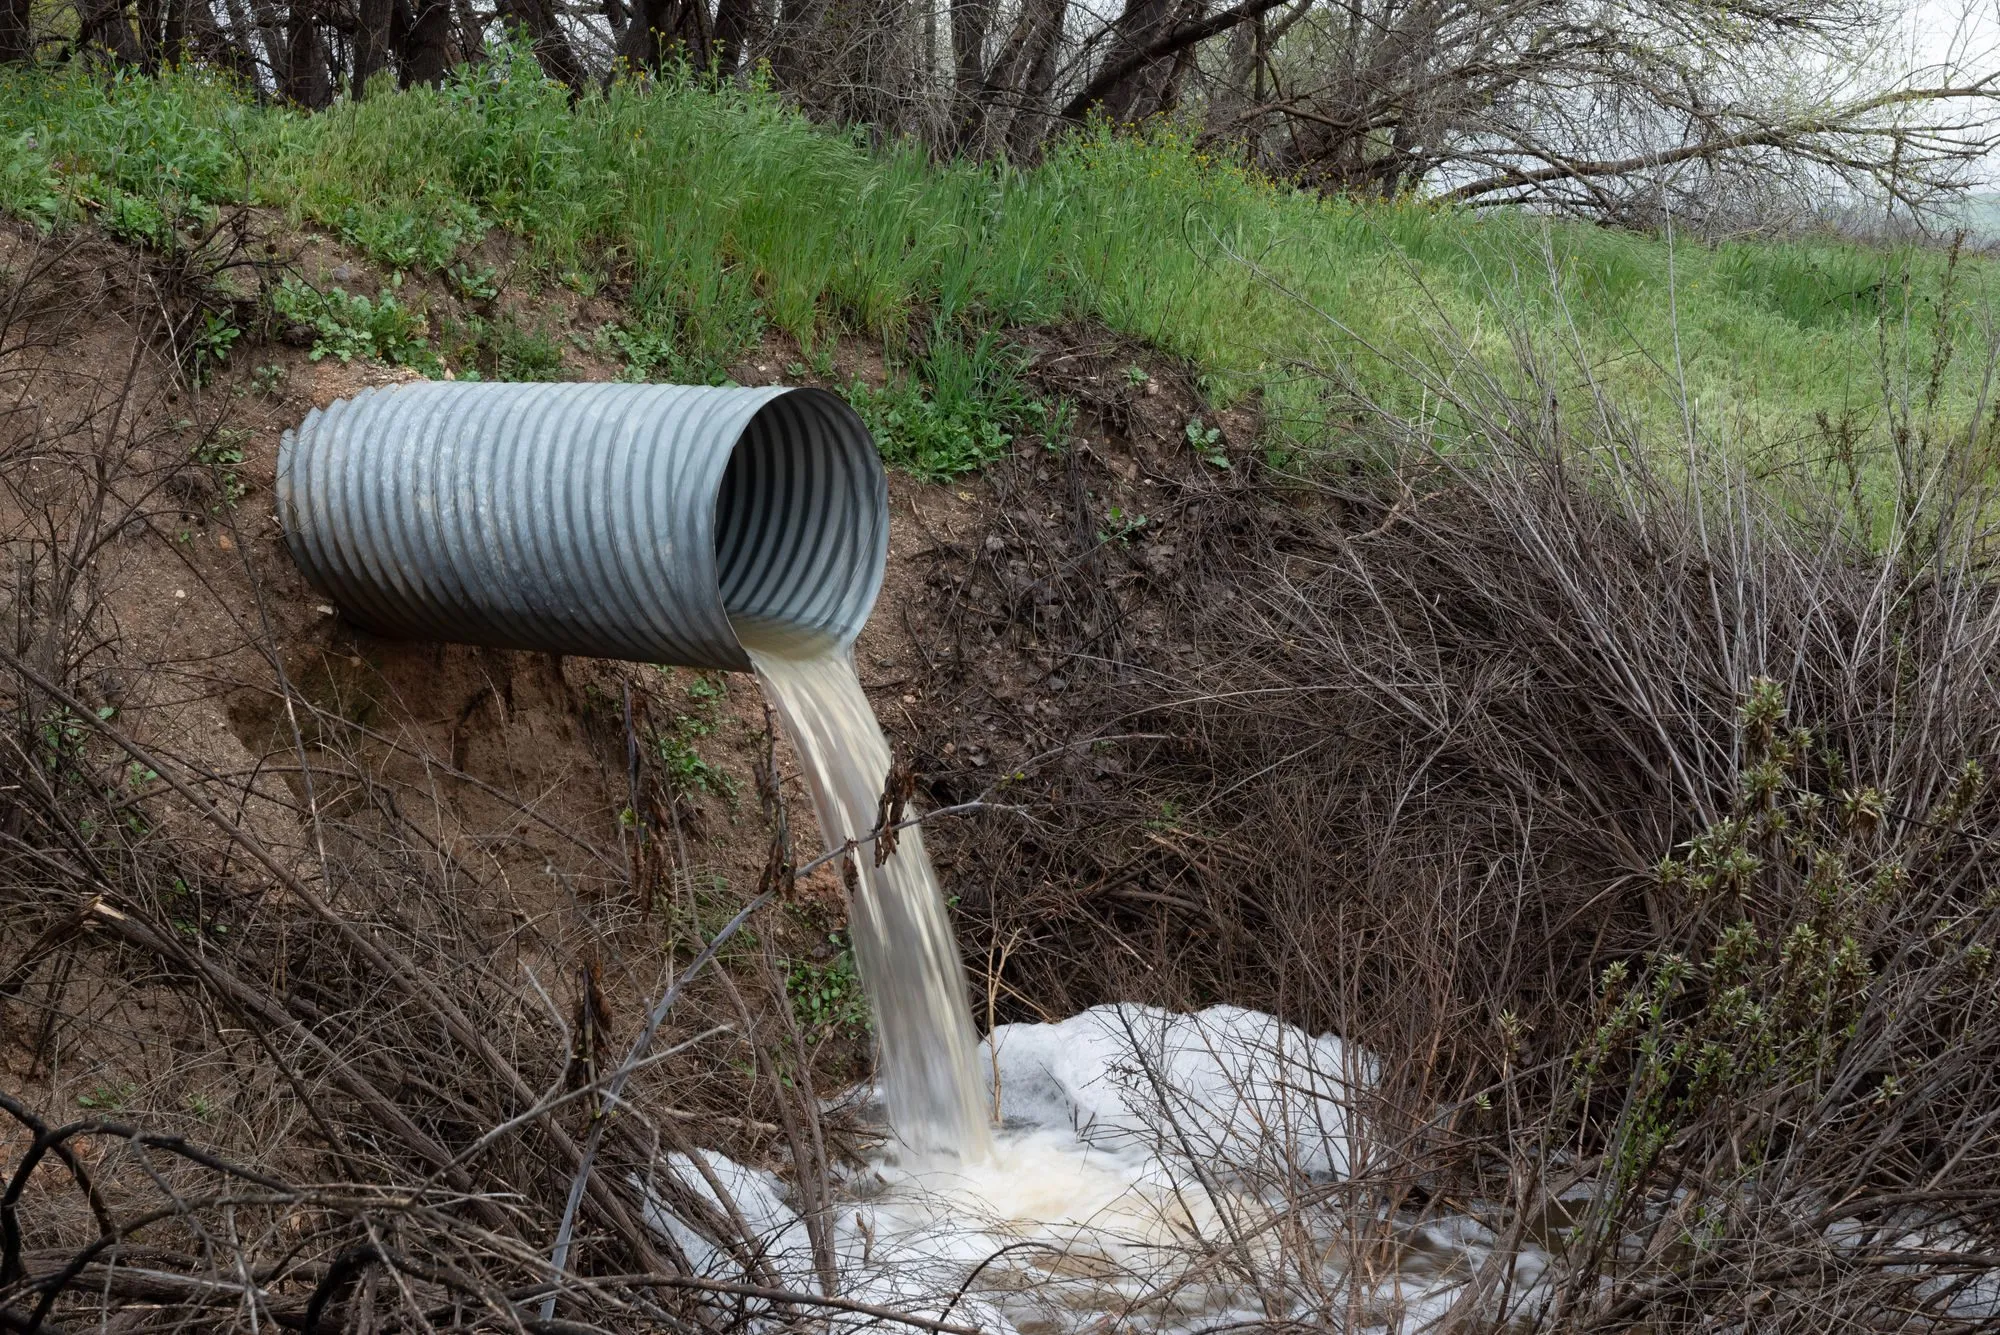
A storm overflow is a release point that lets a sewer discharge into a river or the sea when heavy rain would otherwise flood it. Overflows are meant to operate only during rainfall and snowmelt. They are monitored, and each time one operates is counted as a spill.
The table ranks the 10 companies by the average number of spills per storm overflow in 2025: South West Water's overflows spilled 34.0 times each, United Utilities' 26.8 and Yorkshire Water's 23.6, against an average of 20.5 for England, down from 31.8 in 2024. Anglian Water had the fewest, 12.0. Below the table are each company's total spills and total spill hours.
Key figures
Sewage spills per storm overflow in 2025, by company
Rank 1 had the most spills per overflow. Each company's figure is the average over its storm overflows that reported spill data. Dŵr Cymru Welsh Water's figure covers only its storm overflows in England.
| Rank | Water company | Average sewage spills per storm overflow in 2025 (times each overflow released sewage in the year) | Year |
|---|---|---|---|
| 1 | South West Water | 34.0 | 2025 |
| 2 | United Utilities | 26.8 | 2025 |
| 3 | Yorkshire Water | 23.6 | 2025 |
| 4 | Dwr Cymru Welsh Water (in England) | 23.3 | 2025 |
| 5 | Wessex Water | 18.3 | 2025 |
| 6 | Northumbrian Water | 17.8 | 2025 |
| 7 | Southern Water | 16.0 | 2025 |
| 8 | Thames Water | 15.9 | 2025 |
| 9 | Severn Trent Water | 15.0 | 2025 |
| 10 | Anglian Water | 12.0 | 2025 |
England in 2025
- Storm overflows spilled 292,119 times in 2025.
- Those spills lasted 1,878,240 hours in total, and 14,239 storm overflows had spill data.
- On average each storm overflow spilled 20.5 times in 2025, compared with 31.8 times in 2024.
- Spill numbers fell by 35% on 2024, and total monitored spill duration fell by 48%.
- Much of the improvement reflects unusually dry conditions in 2025 following a particularly wet 2024.
| Category | Sewage spills per storm overflow in 2025 |
|---|---|
| South West Water | 34.0 |
| United Utilities | 26.8 |
| Yorkshire Water | 23.6 |
| Dwr Cymru Welsh Water (in England) | 23.3 |
| Wessex Water | 18.3 |
| Northumbrian Water | 17.8 |
| Southern Water | 16.0 |
| Thames Water | 15.9 |
| Severn Trent Water | 15.0 |
| Anglian Water | 12.0 |
Total spills and spill hours, by company, 2025
- United Utilities: 60,843 spills in 2025, lasting 327,453 hours in total, an average of 5.4 hours each.
- Yorkshire Water: 51,431 spills in 2025, lasting 285,931 hours in total, an average of 5.6 hours each.
- South West Water: 46,164 spills in 2025, lasting 407,006 hours in total, an average of 8.8 hours each.
- Severn Trent Water: 36,471 spills in 2025, lasting 200,361 hours in total, an average of 5.5 hours each.
- Northumbrian Water: 27,860 spills in 2025, lasting 123,803 hours in total, an average of 4.4 hours each.
- Wessex Water: 24,442 spills in 2025, lasting 190,666 hours in total, an average of 7.8 hours each.
- Anglian Water: 17,322 spills in 2025, lasting 105,806 hours in total, an average of 6.1 hours each.
- Southern Water: 15,554 spills in 2025, lasting 114,868 hours in total, an average of 7.4 hours each.
- Thames Water: 9,189 spills in 2025, lasting 107,822 hours in total, an average of 11.7 hours each.
- Dŵr Cymru Welsh Water (its overflows in England): 2,843 spills in 2025, lasting 14,525 hours in total, an average of 5.1 hours each.
What the numbers mean
A storm overflow is supposed to work only in storms, so a high number of spills per overflow means the sewers are overwhelmed often, or that something is wrong with the overflow. The ranking compares the average overflow of each company, so a company with many overflows is not ranked higher just for having more of them.
The three measures answer different questions. Spills per overflow compares companies fairly. Total spills shows the scale: United Utilities recorded 60,843, Yorkshire Water 51,431 and South West Water 46,164. Hours per spill shows how long each release lasts: a Thames Water spill lasted 11.7 hours on average, the longest. Much of the fall from 2024 reflects unusually dry conditions in 2025 following a particularly wet 2024, so it does not show how the sewers will cope in a wet year.