US states with the most lead water pipes
All 50 states and the District of Columbia ranked by the number of lead service lines, the pipes that carry water from the main in the street into homes and other buildings, most first. The counts are EPA's 2025 projections, built from the service line inventories that water systems reported to their states.
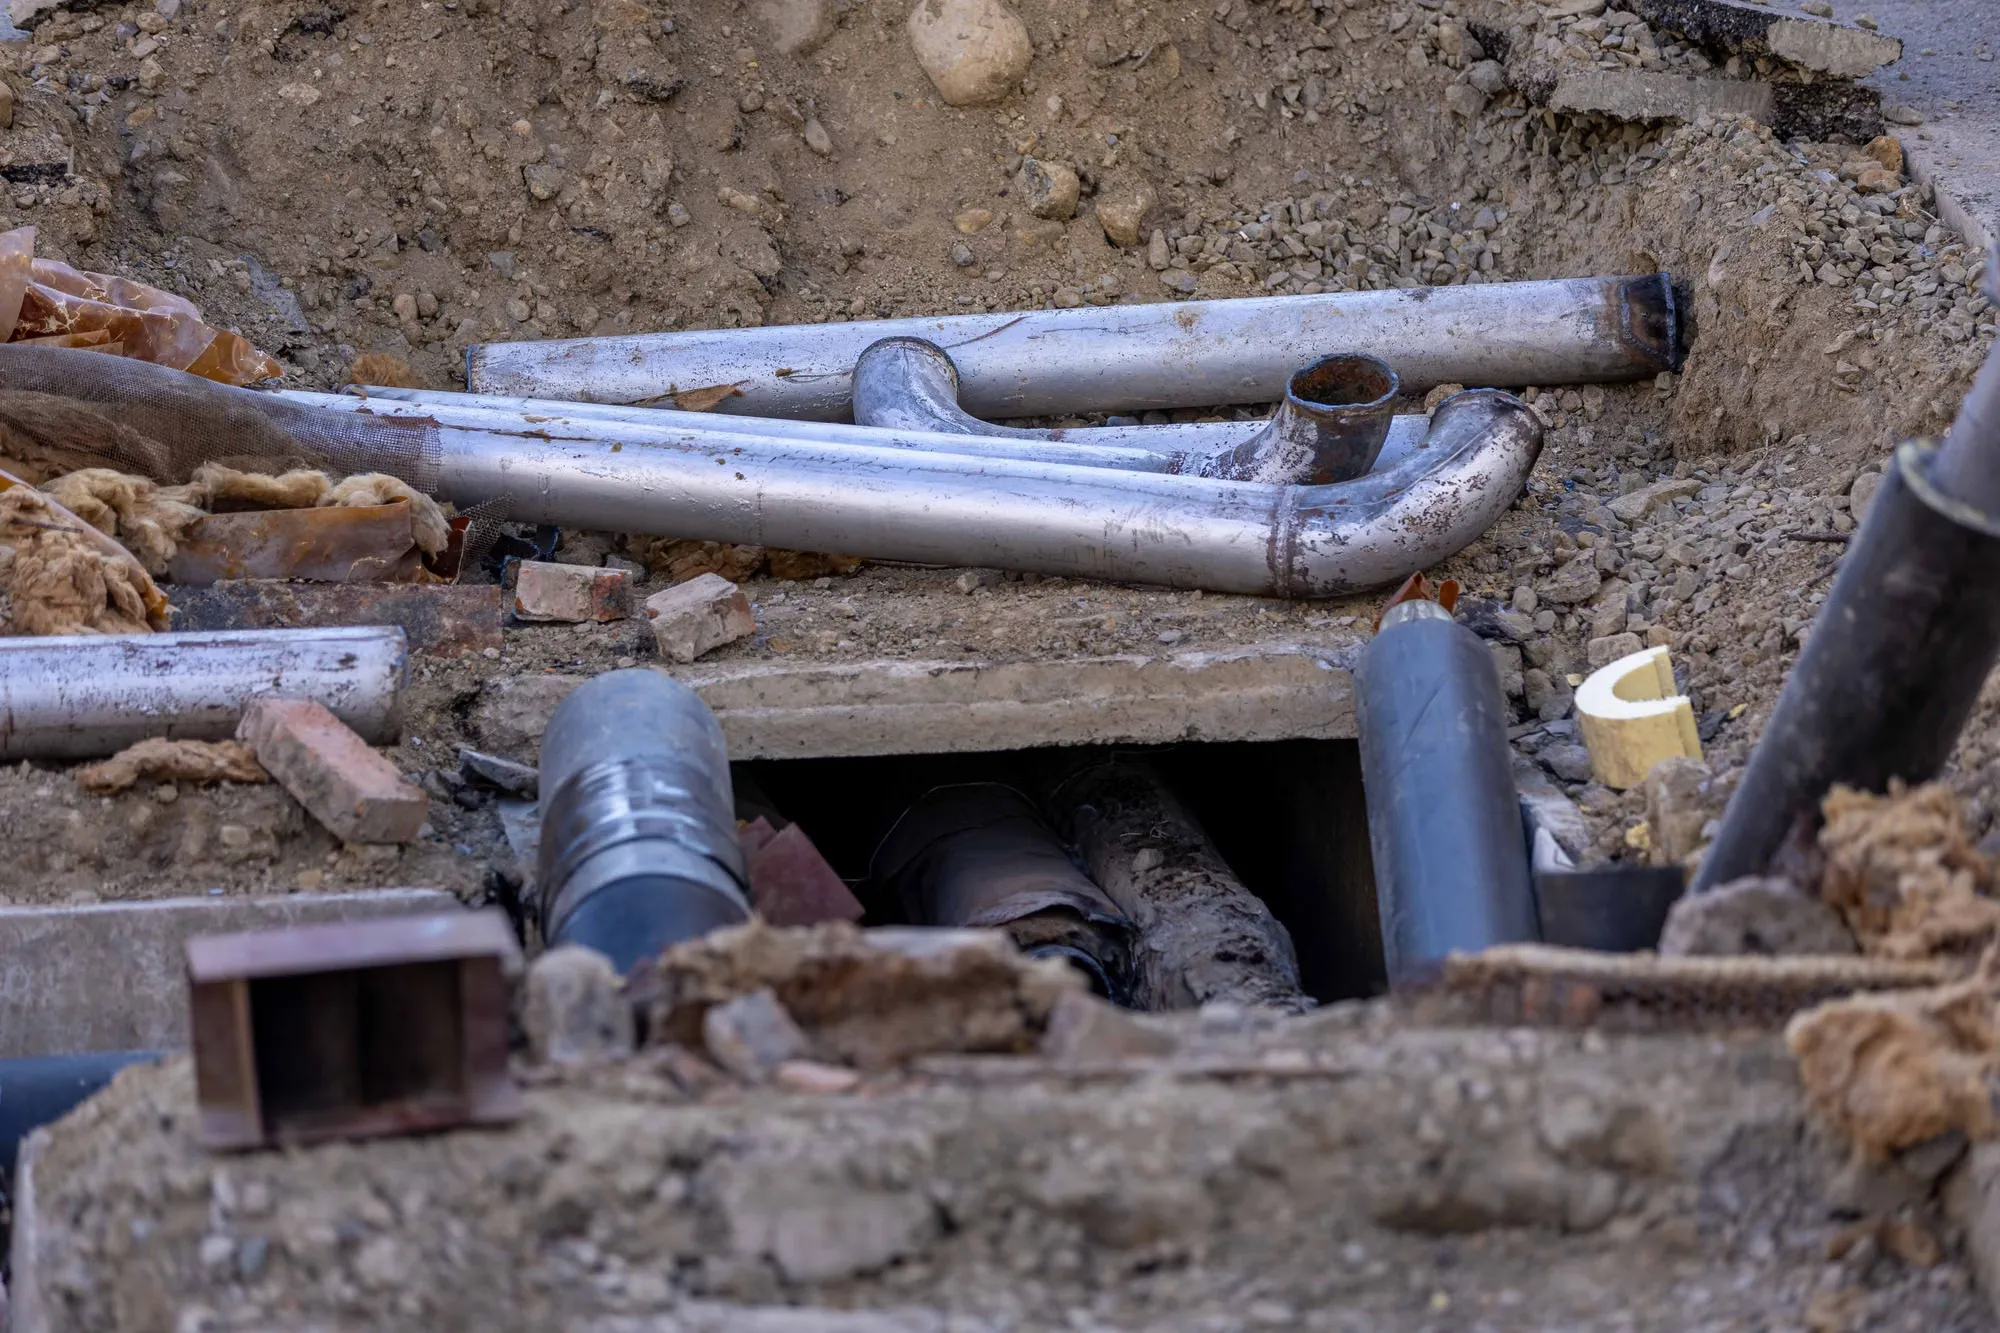
A service line is the pipe that runs from the water main under the street into a building. Lead pipes are a key source of lead in drinking water where they are present, and replacing them is the aim of the $15 billion that the Infrastructure Investment and Jobs Act gave to speed up lead service line replacement. EPA also counts galvanized steel pipes that need replacing as lead lines, because lead can stick to them.
Under the Lead and Copper Rule Revisions, every water system had to make an inventory of its service lines and report it. EPA used those inventories, plus an estimate of how many lines of unknown material are likely to be lead, to project the number of lead lines in every state for its 2025 update. The table ranks the states and the District of Columbia by that projection; the chart shows the ten with the most.
Key figures
Projected lead service lines by state, EPA 2025 projection
Rank 1 has the most lead service lines. Counts include galvanized lines that need replacing, which EPA counts as lead lines, and the share of unknown-material lines EPA predicts are lead. These are counts, not rates: a big state with many old cities has more lines of every kind. Puerto Rico and the US territories are not ranked.
| Rank | State | Projected lead service lines | Projection |
|---|---|---|---|
| 1 | Illinois | 631,642 | 2025 |
| 2 | Ohio | 406,565 | 2025 |
| 3 | New York | 383,390 | 2025 |
| 4 | Michigan | 294,388 | 2025 |
| 5 | Pennsylvania | 264,961 | 2025 |
| 6 | Indiana | 261,897 | 2025 |
| 7 | New Jersey | 206,711 | 2025 |
| 8 | Wisconsin | 193,389 | 2025 |
| 9 | Texas | 143,988 | 2025 |
| 10 | Missouri | 117,273 | 2025 |
| 11 | Minnesota | 108,200 | 2025 |
| 12 | Kansas | 97,421 | 2025 |
| 13 | Iowa | 95,724 | 2025 |
| 14 | Tennessee | 81,796 | 2025 |
| 15 | Alabama | 67,963 | 2025 |
| 16 | Nebraska | 55,754 | 2025 |
| 17 | Georgia | 53,857 | 2025 |
| 18 | Florida | 51,707 | 2025 |
| 19 | Massachusetts | 51,506 | 2025 |
| 20 | Rhode Island | 38,954 | 2025 |
| 21 | Louisiana | 36,189 | 2025 |
| 22 | Kentucky | 36,093 | 2025 |
| 23 | South Carolina | 30,786 | 2025 |
| 24 | Mississippi | 26,692 | 2025 |
| 25 | Colorado | 24,017 | 2025 |
| 26 | Arkansas | 19,233 | 2025 |
| 27 | District of Columbia | 18,978 | 2025 |
| 28 | Virginia | 18,404 | 2025 |
| 29 | Oklahoma | 16,457 | 2025 |
| 30 | North Carolina | 15,260 | 2025 |
| 31 | West Virginia | 13,792 | 2025 |
| 32 | California | 12,243 | 2025 |
| 33 | Connecticut | 11,307 | 2025 |
| 34 | North Dakota | 10,050 | 2025 |
| 35 | Delaware | 9,431 | 2025 |
| 36 | New Hampshire | 9,292 | 2025 |
| 37 | Washington | 7,982 | 2025 |
| 38 | Wyoming | 5,322 | 2025 |
| 39 | Maryland | 5,048 | 2025 |
| 40 | South Dakota | 5,031 | 2025 |
| 41 | Montana | 4,037 | 2025 |
| 42 | Idaho | 3,270 | 2025 |
| 43 | Arizona | 3,048 | 2025 |
| 44 | Maine | 2,017 | 2025 |
| 45 | Vermont | 1,587 | 2025 |
| 46 | Nevada | 1,270 | 2025 |
| 47 | Utah | 1,022 | 2025 |
| 48 | Hawaii | 419 | 2025 |
| 49 | New Mexico | 409 | 2025 |
| 50 | Oregon | 60 | 2025 |
| 51 | Alaska | 4 | 2025 |
Across the United States
- EPA projects 3,956,383 lead service lines across the states and territories in its 2025 update: 2,659,983 made of lead and 1,296,400 galvanized lines that need replacing.
- That is 3.8% of the 102,958,322 service lines in EPA's projection; the other 99,001,939 are not lead.
- EPA's November 2025 fact sheet puts the total at 4 million lead service lines: 3 million reported by water systems and 1 million lines of unknown material that are predicted to be lead.
| Category | Lead service lines |
|---|---|
| Illinois | 631,642 |
| Ohio | 406,565 |
| New York | 383,390 |
| Michigan | 294,388 |
| Pennsylvania | 264,961 |
| Indiana | 261,897 |
| New Jersey | 206,711 |
| Wisconsin | 193,389 |
| Texas | 143,988 |
| Missouri | 117,273 |
What the numbers mean
Illinois has the most lead pipes by a wide margin, 631,642, followed by Ohio with 406,565 and New York with 383,390. Great Lakes and Northeast states fill most of the top ten; Texas and Missouri are the only states in it from outside those regions.
A count favours big states, so the share of all service lines that are lead tells a second story. Illinois 16.5%, District of Columbia 13.8%, Wisconsin 13.5%, Rhode Island 13.3%, Indiana 12.5% have the highest shares. At the bottom, Oregon has 60 and Alaska 4.
Sources
- 2025 Updated Service Line Projections, 7th Drinking Water Infrastructure Needs Survey and Assessment (EPA, xlsx)
- Fact Sheet: 2025 Update to the 7th Drinking Water Infrastructure Needs Survey and Assessment (EPA, November 2025)
- EPA's 7th Drinking Water Infrastructure Needs Survey and Assessment (EPA)