US states where PFAS turns up in the most water systems
The 50 states ranked by the share of their tested public water systems where at least one PFAS, the long-lasting "forever chemicals", was found in drinking water, highest first. The results are from EPA's final nationwide PFAS testing, sampled from 2023 to 2025 and released in 2026.
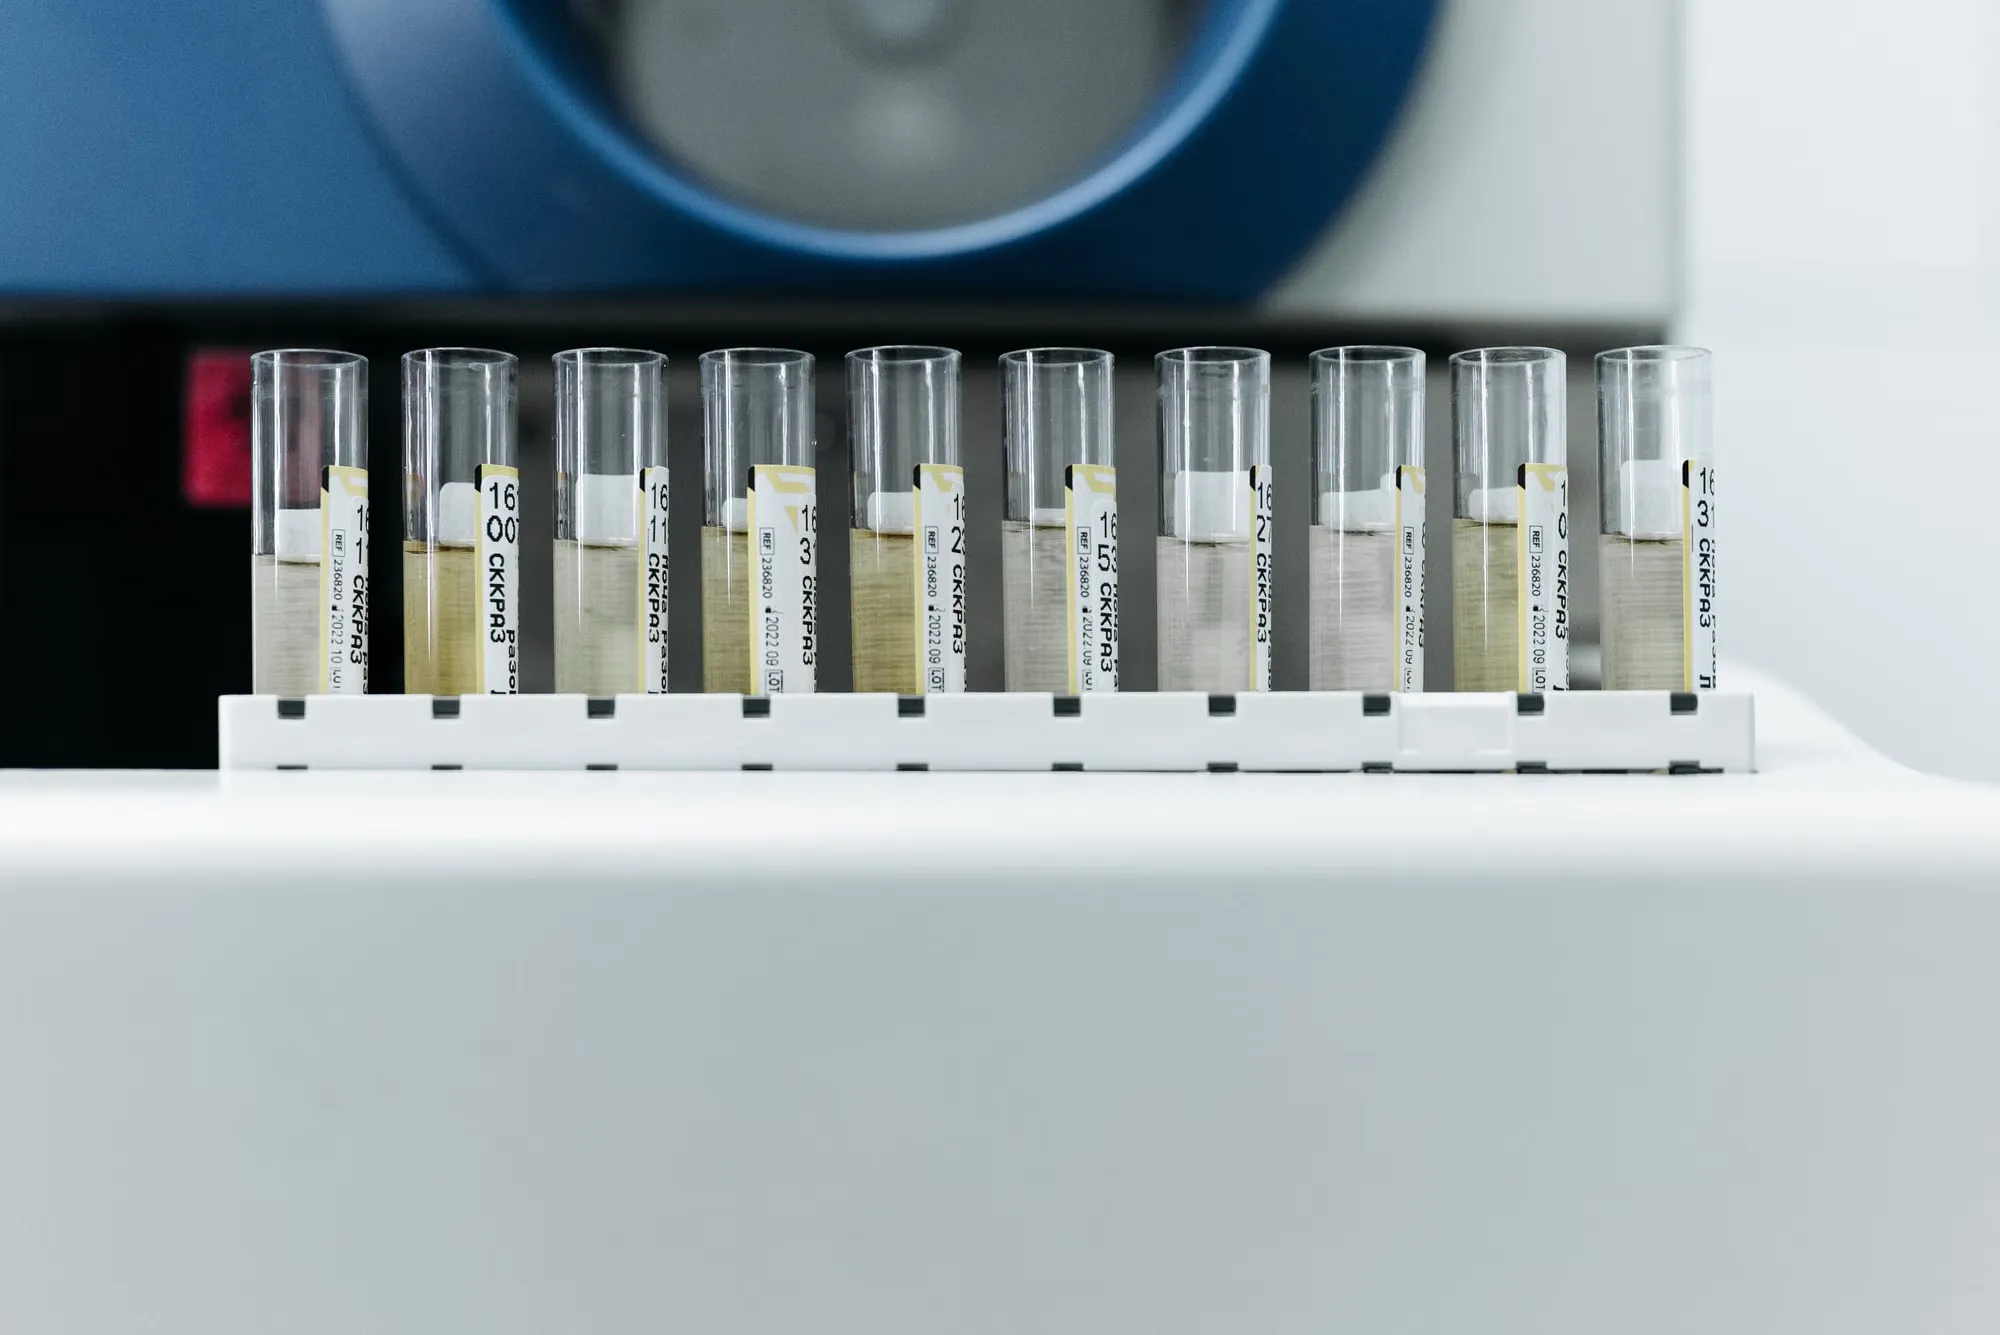
PFAS (per- and polyfluoroalkyl substances) are a large family of man-made chemicals. In 2024 EPA set legal limits for six of them in drinking water, and expects that rule to prevent PFAS exposure in drinking water for about 100 million people and to prevent thousands of deaths over many years. From 2023 to 2025 EPA had every public water system serving 3,300 people or more, and a representative sample of smaller ones, test its drinking water for 29 PFAS. This was the fifth round of EPA's monitoring for unregulated contaminants, known as UCMR 5.
This page counts a water system as having PFAS found when at least one sample had at least one of the 29 chemicals at or above the lowest level EPA asked labs to report, between 2 and 20 parts per trillion depending on the chemical. The table ranks the 50 states by the share of their tested systems where that happened; the chart shows the ten highest.
Key figures
Tested water systems where PFAS was found, by state, 2023 to 2025
Rank 1 has the highest share. A system counts when at least one of its samples had at least one of the 29 PFAS at or above EPA's reporting level. States test different numbers of systems (Texas 1,154, Delaware 36), so a few systems move a small state's share more. The District of Columbia (3 systems tested, PFAS found at all 3) and the territories are not ranked.
| Rank | State | Tested water systems where PFAS was found (%) | Tested |
|---|---|---|---|
| 1 | New Jersey | 65.7 | 2023-2025 |
| 2 | Connecticut | 63.5 | 2023-2025 |
| 3 | South Carolina | 55.2 | 2023-2025 |
| 4 | Massachusetts | 54.8 | 2023-2025 |
| 5 | Texas | 53.9 | 2023-2025 |
| 6 | Rhode Island | 51.7 | 2023-2025 |
| 7 | North Carolina | 50.2 | 2023-2025 |
| 8 | Florida | 47.7 | 2023-2025 |
| 9 | Delaware | 47.2 | 2023-2025 |
| 10 | Pennsylvania | 45.1 | 2023-2025 |
| 11 | Minnesota | 44.9 | 2023-2025 |
| 12 | Oklahoma | 41.0 | 2023-2025 |
| 13 | Ohio | 40.9 | 2023-2025 |
| 14 | Alabama | 38.1 | 2023-2025 |
| 15 | Kentucky | 37.7 | 2023-2025 |
| 16 | Arizona | 37.5 | 2023-2025 |
| 17 | Maryland | 36.1 | 2023-2025 |
| 18 | New Hampshire | 35.3 | 2023-2025 |
| 19 | Kansas | 34.0 | 2023-2025 |
| 20 | California | 33.8 | 2023-2025 |
| 21 | West Virginia | 33.0 | 2023-2025 |
| 22= | Georgia | 31.6 | 2023-2025 |
| 22= | Virginia | 31.6 | 2023-2025 |
| 24 | Missouri | 31.5 | 2023-2025 |
| 25 | Tennessee | 31.4 | 2023-2025 |
| 26 | Alaska | 30.0 | 2023-2025 |
| 27 | New York | 29.9 | 2023-2025 |
| 28 | Washington | 27.4 | 2023-2025 |
| 29 | Illinois | 26.3 | 2023-2025 |
| 30 | Wisconsin | 25.7 | 2023-2025 |
| 31 | Maine | 24.4 | 2023-2025 |
| 32 | Indiana | 23.9 | 2023-2025 |
| 33 | Colorado | 23.6 | 2023-2025 |
| 34 | Iowa | 21.1 | 2023-2025 |
| 35 | North Dakota | 18.4 | 2023-2025 |
| 36 | Louisiana | 17.9 | 2023-2025 |
| 37 | Nevada | 16.9 | 2023-2025 |
| 38 | New Mexico | 15.1 | 2023-2025 |
| 39 | Idaho | 14.8 | 2023-2025 |
| 40 | South Dakota | 14.3 | 2023-2025 |
| 41 | Oregon | 14.2 | 2023-2025 |
| 42 | Michigan | 13.8 | 2023-2025 |
| 43 | Nebraska | 13.2 | 2023-2025 |
| 44 | Utah | 12.4 | 2023-2025 |
| 45 | Montana | 11.1 | 2023-2025 |
| 46 | Wyoming | 9.1 | 2023-2025 |
| 47 | Vermont | 7.9 | 2023-2025 |
| 48 | Arkansas | 5.8 | 2023-2025 |
| 49 | Hawaii | 4.4 | 2023-2025 |
| 50 | Mississippi | 3.8 | 2023-2025 |
Across the United States
- At least one PFAS was found in the drinking water of 3,595 of the 10,312 public water systems tested from 2023 to 2025, 34.9%.
- PFOA or PFOS, the two PFAS with a federal limit of 4 parts per trillion, was found at or above 4 parts per trillion in at least one sample at 1,739 systems, 16.9% of those tested.
- EPA's own comparison of yearly averages with the 2024 limits found 15.5% of large systems (serving more than 10,000 people) above a limit, and estimates 7.8% of all public water systems nationwide.
- Where PFAS was found, it was often more than one: 66% of sampling points with any PFAS had two or more.
| Category | % of tested water systems where PFAS was found |
|---|---|
| New Jersey | 65.7 |
| Connecticut | 63.5 |
| South Carolina | 55.2 |
| Massachusetts | 54.8 |
| Texas | 53.9 |
| Rhode Island | 51.7 |
| North Carolina | 50.2 |
| Florida | 47.7 |
| Delaware | 47.2 |
| Pennsylvania | 45.1 |
What the numbers mean
New Jersey (174 of 265 tested systems) and Connecticut (40 of 63) lead the ranking, with South Carolina, Massachusetts, Texas, Rhode Island and North Carolina all above half.
Found is not the same as unsafe. The reporting levels are 2 to 20 parts per trillion, and most of the chemicals have no federal limit. The sharper test is PFOA and PFOS, which have a limit of 4 parts per trillion as a yearly average: New Jersey 58.5%, Connecticut 55.6%, Massachusetts 41.4%, South Carolina 40.6%, North Carolina 40.2% of tested systems had at least one sample at that level or above. The limit is enforced from 2029 under the 2024 rule, and EPA has proposed giving systems until 2031.
Sources
- UCMR 5 occurrence data text files (EPA, final dataset released August 2026, zip)
- The Fifth Unregulated Contaminant Monitoring Rule (UCMR 5) Data Summary: July 2026 (EPA)
- Occurrence data for the Unregulated Contaminant Monitoring Rule (EPA)
- Per- and Polyfluoroalkyl Substances (PFAS): final PFAS National Primary Drinking Water Regulation (EPA)